Navigating the landscape of U.S. politics can feel like trying to find your way out of a corn maze—confusing and full of surprises. With a political map in hand, one can uncover the colorful divisions and alliances that shape the nation’s governance. From red states to blue states and everything in between, understanding these political boundaries is crucial for anyone wanting to stay informed.
Overview Of The Map Of US Political Landscape
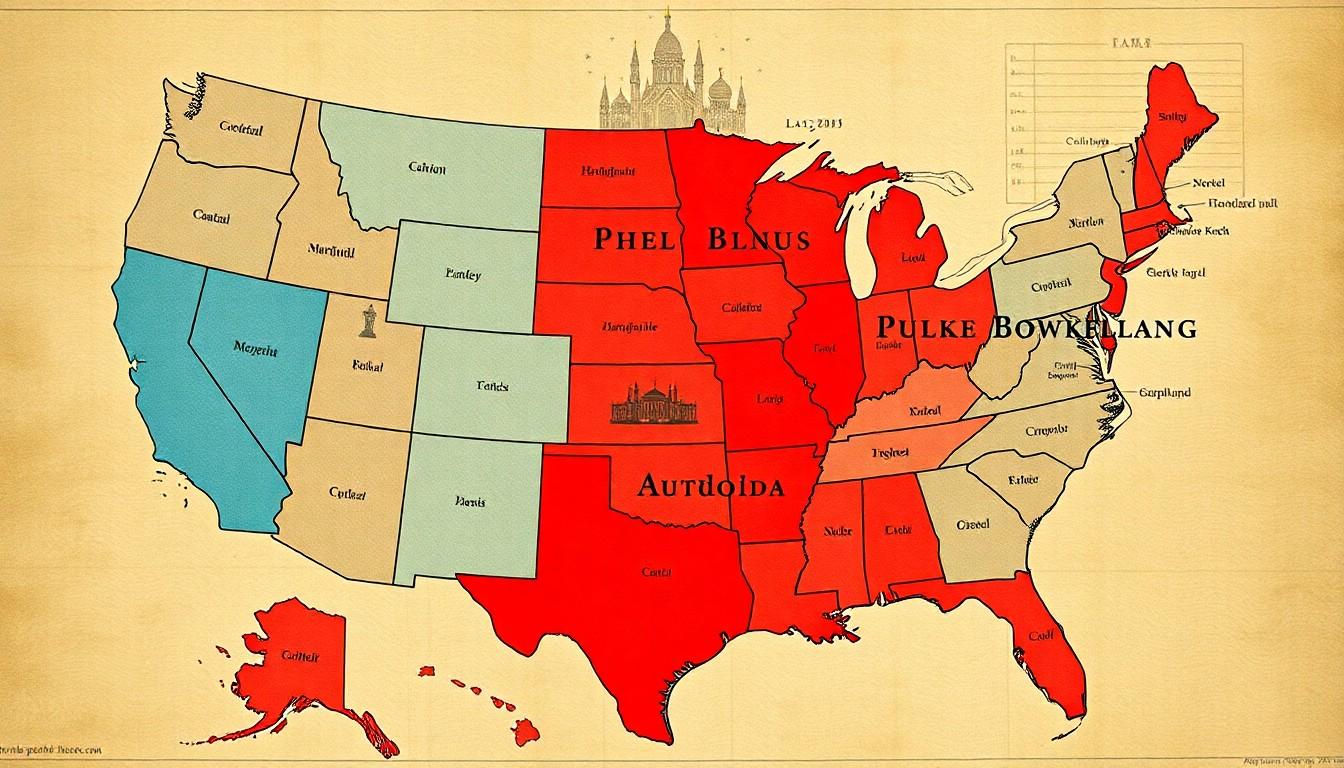
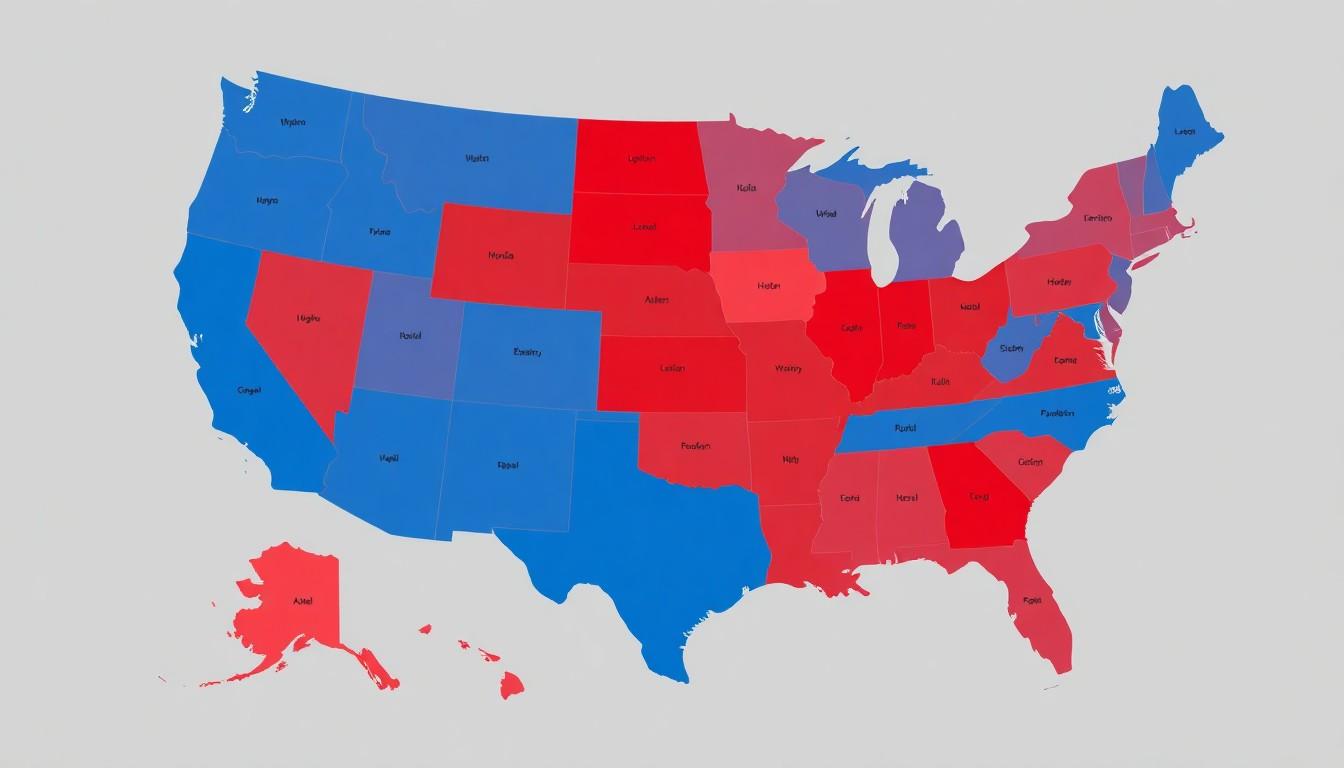
The U.S. political landscape features a variety of regions, each exhibiting distinct political tendencies. Red states predominantly support the Republican Party while blue states lean towards the Democratic Party. Several swing states, such as Florida and Ohio, often determine election outcomes due to their fluctuating political affiliations.
Geographically, the Northeast showcases strong Democratic support, as seen in states like Massachusetts and New York. The Midwest displays a mixed political spectrum, with states such as Wisconsin and Michigan recently shifting towards Democratic candidates. The South mainly identifies with Republican values, creating a solid block of red states, including Texas and Alabama.
Voter demographics play a crucial role in shaping political ideologies within these regions. Ethnic diversity in urban areas often correlates with Democratic support, as seen in cities like Los Angeles and Chicago. Rural areas, however, typically exhibit Republican preferences, emphasizing traditional values and conservative policies.
Understanding the electoral college system is essential for comprehending how political power shifts. Each state carries varying electoral votes based on its population, influencing presidential elections significantly. This factor underscores the importance of swing states, as their votes can tilt the election balance.
Current political trends reveal an increasing polarization within the United States, with partisanship intensifying over recent years. Social issues often drive divisions, reflecting differing attitudes on topics like healthcare, immigration, and climate change. Recognizing these dynamics is vital for anyone aiming to navigate the complexities of U.S. politics effectively.
Historical Context

Understanding the historical context of U.S. political maps reveals significant shifts in political alignments and boundaries.
Evolution Of Political Maps
Political maps in the U.S. have evolved substantially since the country’s founding. These maps reflect changing ideologies and regional interests over time. Initially, Federalists and Democratic-Republicans dominated the scene. Major shifts occurred during the Civil War, creating stark divides. Post-war realignments saw the rise of the Democratic South and the Republican North. The late 20th century introduced significant demographic changes, leading to the rise of swing states. Voter mobilization and shifts in key issues shaped the political landscape, influencing how states align today. As a result, current maps illustrate deepening red and blue divisions based on electoral outcomes.
Key Historical Events Shaping Political Boundaries
Numerous historical events significantly shaped U.S. political boundaries. The Civil Rights Movement catalyzed shifts in party support among Southern voters, redefining political boundaries. Landmark legislation like the Voting Rights Act of 1965 increased electoral participation, particularly among minorities. The Watergate scandal altered public trust in government, laying the groundwork for future political divisions. Each presidential election cycle has introduced new issues, often causing states to reassess their political affiliations. These factors combined have contributed to contemporary politics, with swing states becoming critical in election outcomes.
Current Political Divisions
The U.S. political landscape exhibits distinct divisions that are critical to understanding its governance.
Understanding Red States And Blue States
Red states consistently support the Republican Party, showcasing conservative values across various issues. In contrast, blue states generally lean toward the Democratic Party, emphasizing progressive policies. Residents in urban areas often gravitate toward Democratic ideals, while those in rural regions tend to favor Republican principles. Demographic factors like population density and education levels play a significant role in shaping these political affiliations. Notably, states like California and New York exemplify blue strongholds, while Texas and Alabama illustrate red state characteristics. Recognizing these patterns helps in grasping the broader dynamics of U.S. politics.
The Role Of Swing States
Swing states hold tremendous influence over general elections due to their unpredictable voting patterns. Florida and Ohio often represent voters’ sentiments, making them vital battlegrounds. Candidates focus heavily on these regions to secure electoral votes, given the impact they have on outcomes. Economic conditions, social issues, and demographic changes frequently sway opinions in swing states. No single party dominates these areas, leading to fluctuating results in presidential elections. Such variability emphasizes the importance of understanding local issues, as they can ultimately determine national leadership.
Resources And Tools For Analyzing Political Maps
Numerous resources exist for analyzing U.S. political maps, offering insights through various methods.
Online Interactive Maps
Online interactive maps serve as valuable tools for visualizing political trends. Websites like FiveThirtyEight and Political Map analyze electoral data, providing up-to-date information on voting patterns and demographics. Users can engage with maps that display detailed results from past elections, highlighting shifts in political affiliations. Geographic Information Systems (GIS) platforms, such as ArcGIS Online, enable users to create custom maps, overlaying data such as income levels and education to reveal correlations between demographics and political support. These tools enhance understanding of how voters make decisions across different regions.
Data Visualization Techniques
Data visualization techniques transform complex political data into comprehensible visuals. Charts and graphs effectively illustrate voter turnout rates and party affiliation trends, making information accessible. Infographics combine visuals with statistics, providing quick insights into election outcomes and demographic shifts. Platforms like Tableau offer advanced analytics and interactive dashboards, allowing users to explore relationships among various political factors dynamically. Utilizing heat maps showcases variations in voting behavior across geographic areas, making it easier to identify key trends and shifts within the political landscape.
Implications Of Political Mapping
Political mapping significantly influences elections and voter behavior, playing a crucial role in understanding trends and shifts within the electorate. Different states exhibit varying political landscapes that can sway campaigns and voter turnout. For instance, swing states often experience heightened focus from candidates due to their unpredictable voting patterns. Voter demographics in these states, influenced by factors like age, race, and income, impact voter sentiment. Furthermore, polling data showcases how local issues can drive electoral decisions, emphasizing the need for candidates to connect with specific state concerns.
Mapping also shapes political strategy, guiding campaign efforts and resource allocation. Candidates analyze political maps to identify key demographics and voter bases. They prioritize regions requiring increased outreach, such as urban centers that lean Democratic or rural areas favoring Republicans. Understanding geographic trends allows campaigns to tailor messaging effectively, appealing to local interests. Additionally, targeted advertisements based on regional data enhance engagement. Knowledge of political map dynamics ultimately steers strategic decisions, ensuring campaigns resonate with voters on a more personal level.
Conclusion
Understanding the U.S. political map is crucial for grasping the dynamics of the nation’s governance. The interplay between red and blue states reveals deeper regional values and priorities that shape political discourse. Swing states serve as the focal points in elections, reflecting the evolving sentiments of voters influenced by various factors.
As political polarization continues to rise, keeping an eye on these trends is vital for anyone interested in U.S. politics. Utilizing available resources and tools can enhance comprehension of electoral patterns and voter behavior. This knowledge not only informs citizens but also empowers them to engage meaningfully in the democratic process.

